
Wrestleknownothing
-
Posts
5,980 -
Joined
-
Last visited
-
Days Won
70
Content Type
Forums
Articles
Teams
College Commitments
Rankings
Authors
Jobs
Store
Everything posted by Wrestleknownothing
-
Shapiro - is he really a threat to win it as Freshman?
Wrestleknownothing replied to Dark Energy's topic in College Wrestling
I used to read his posts. I just skip over them now. -
Shapiro - is he really a threat to win it as Freshman?
Wrestleknownothing replied to Dark Energy's topic in College Wrestling
None. The answer is none. Every Junior Freestyle World Champ is a Junior Freestyle WORLD CHAMP. -
You think a guy who goes to Worlds and stays in the back room while his assistants man the corner really celebrates other's failures? I do not.
-
I thought you were kidding when I first read this, but nope. https://cdn.uww.org/s3fs-public/2020-02/03_draw_blockchain_explanations.pdf?VersionId=4gWn7NLIg3LIRX1zcRyzCUM4leX6Zu.8
-
Shapiro - is he really a threat to win it as Freshman?
Wrestleknownothing replied to Dark Energy's topic in College Wrestling
Why likely? -
Anyone who read the article that you posted, but obviously didn't read.
-
Is Penn State Twice as Good as Anyone Else?
Wrestleknownothing replied to Wrestleknownothing's topic in College Wrestling
Yes, it was Oklahoma State (read the wrong column), but the 50% was accurate. Yes, Intermat does include freshman. -
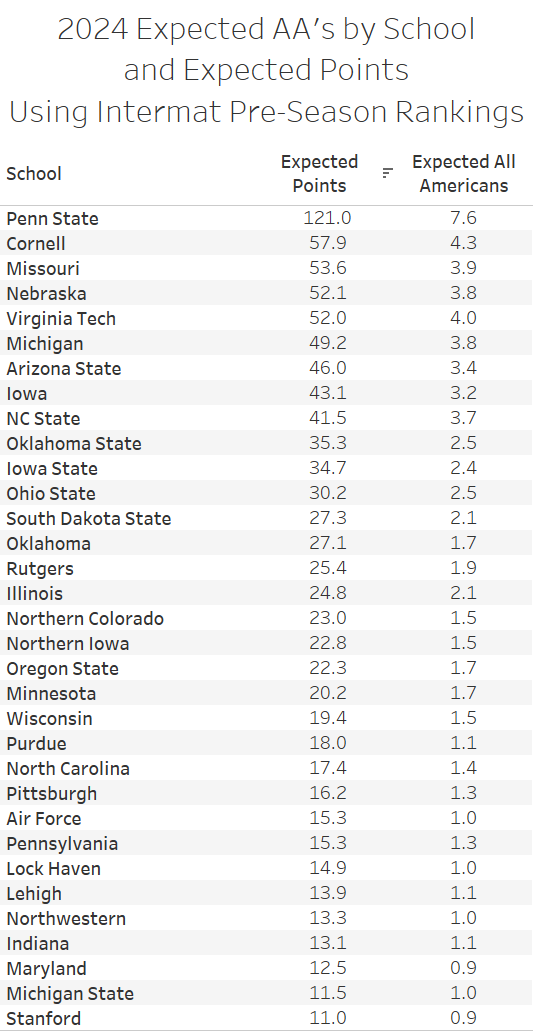
Using Intermat's pre-season rankings and the average placement and advancement points from the 16 seed and 33 seed eras (2014 - 2023), but without any attempt to guess at bonus points, PSU's expected score is more than double (109% higher than) the next closest rival, Cornell. This is fairly unprecedented. The only times a first place team doubled (or more) the second place team were in the late 1930's. But scoring was so different back then as to make the comparison meaningless. When the 1997 Iowa team set the team scoring mark, they "only" beat Minnesota by 50%. And the modern record for spread between first and second is 88% by the 1986 Iowa team. The scores above assume that every team will perform to the average of recent history and does not account for any over or under performance that may occur.

-
What is this pre-Cael concept you speak of?
-
Who remembers the volcano bond? This was my all time favorite crypto project. El Salvador had it right. Issue a bond that was, through a word cloud of some sort, tied to geothermal energy from a volcano, bitcoin, and a new bitcoin city for bitcoin miners powered by that volcano. I have no idea how that idea could miss. https://frankmuci.substack.com/p/el-salvadors-volcano-bond-rip
-
Paris 2024 Olympic Freestyle Team
Wrestleknownothing replied to RandolphTJones's topic in International Wrestling
My single biggest question, too. We get our first data point in November with the Farrell. Does he sign up? If he signs up, does he compete? -
Let's talk about the brown stuff...
Wrestleknownothing replied to Wrestleknownothing's topic in Non Wrestling Topics
Great production values. Whoever writes his scripts definitely finished first grade. The unnamed trophy as prop in a TP commercial was the perfect choice. And they adhered to the first three rules of marketing: never show the product, rush through your pitch, speak like you have marbles in your mouth. -
You think people trying to block the peaceful transfer of power are not dangerous?
-
It doesn't matter who is more dangerous.
-
Good question. I didn't originally read your reply as being about wrestling, but using a wrestling related story to introduce a non-wrestling related concept that may, or may not even apply, because it is something that bothers you. But as I re-read it I think that is too harsh an interpretation. My apologies.
-
Everyone's All-American
Wrestleknownothing replied to Wrestleknownothing's topic in College Wrestling
It's about the company you keep.
-
Everyone's All-American
Wrestleknownothing replied to Wrestleknownothing's topic in College Wrestling
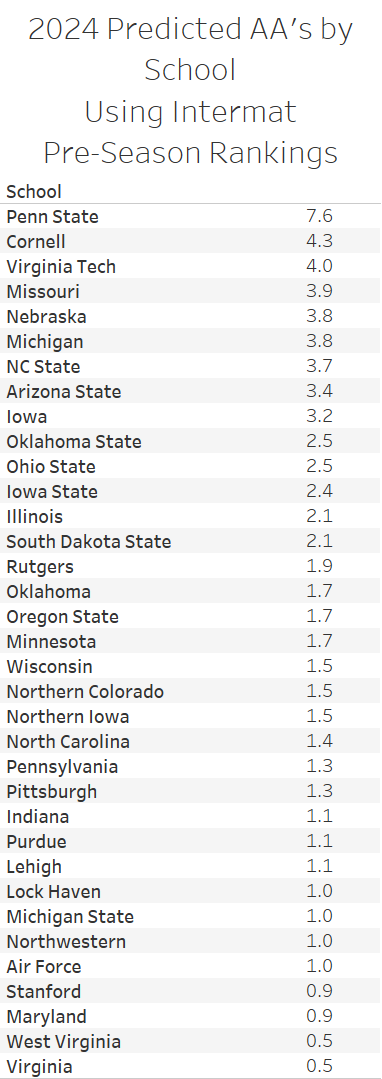
Based on the Intermat Pre-Season Rankings and using historical probability of finishing top 8 by seed, I give you my projected AA totals by school for all schools with ~1 AA (rounding up in some cases): You may note that there are 35 schools on my list. That would be at the high end of the range for the number of schools with at least 1 AA. The last time there were 35 was 2016. Interpreting the Decimal AA's come in whole numbers, so how can I have decimals? The way to interpret the decimal is that it represents the probability of the next whole number greater than the number to the left of the decimal. For example, PSU is listed at 7.6 Predicted AA's. This means there is a 60% chance they will have 8 AA's (and a 40% chance they will have 7 AA's).* *That is a bit of a simplification. I am slightly overstated the probability of 8 and 7 in my example by slightly understating the probabilities of 9, 10, 6, 5, 4, 3, 2, 1, and 0. But that result is no more interesting than the one I give.
-
We are going to get along just fine.
-
Everyone's All-American
Wrestleknownothing replied to Wrestleknownothing's topic in College Wrestling
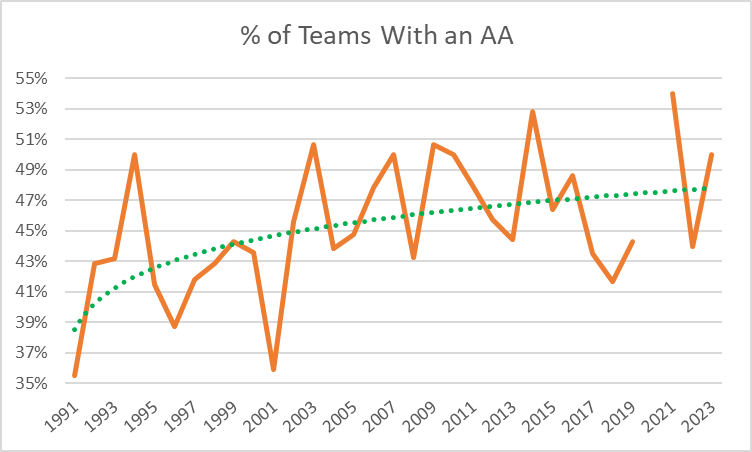
If you are looking for a sniff of parity in a sport of dynasties, look no further. Since the tournament became approximately 33 man brackets, the percentage of teams entered that have at least one AA has trended higher. More for everyone.
-
Like in a bacon, and lettuce, and tomato sandwich?
-
There is this whole other world called Non Wrestling Topics
-
I think it is being called US Olympic Qualifier this year instead of US Open for that reason.
-
I was wondering if there were any weights where guys could get boxed out.
-
Potentially: 2023 Bill Farrell International Open (November, 2023) The highest placed Senior Freestyle USA athlete per weight category, that places in the top 4, who has yet to qualify, will earn a spot in the 2024 U.S. Olympic Trials - Wrestling.